Ball Appearance Patterns Across UK Lotto and EuroMillions Histories
Mia Günther · Aug 24, 2026
Ball Appearance Patterns Across UK Lotto and EuroMillions Histories
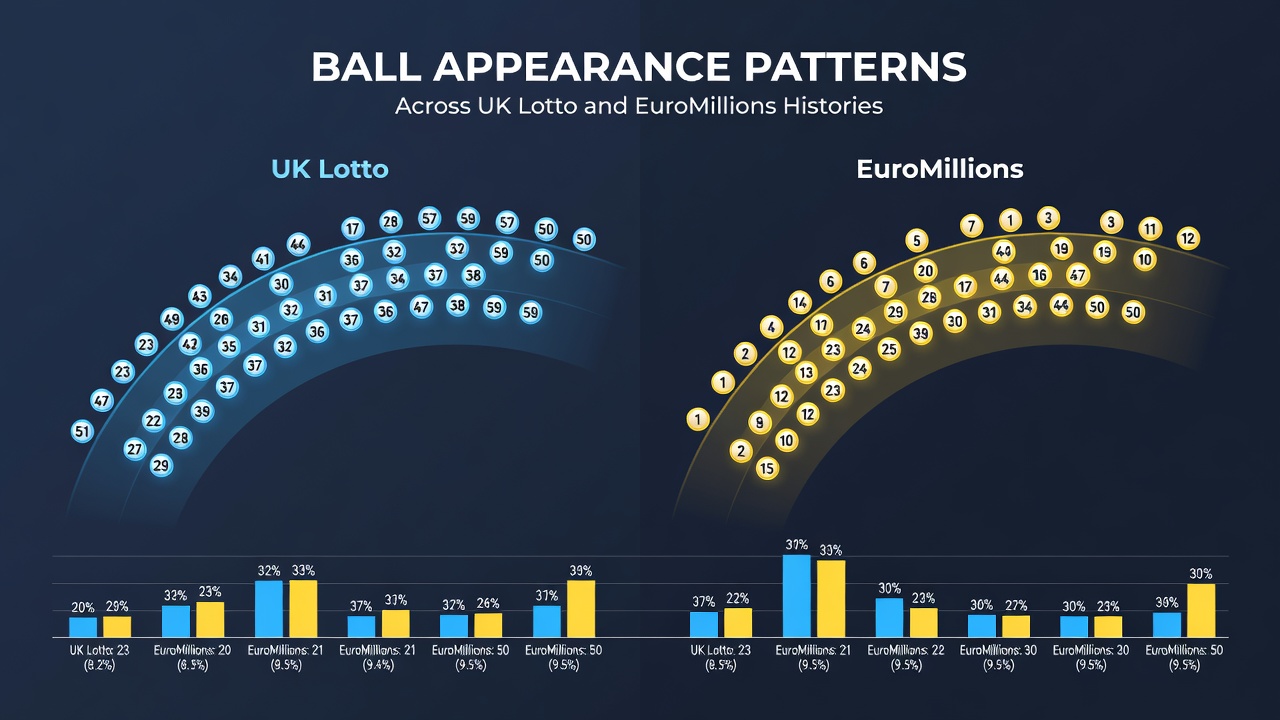
Ball appearance patterns in UK Lotto and EuroMillions emerge from decades of draws that generate extensive numerical records, and analysts track these frequencies to understand distribution trends across both games. UK Lotto selects six main numbers from a pool of fifty-nine while EuroMillions draws five main numbers from fifty plus two Lucky Stars from twelve, and each format produces distinct yet comparable appearance data over time.
Historical Frequency Distributions in UK Lotto
Data compiled since the game's launch in nineteen ninety-four shows certain numbers appearing more often than others in the main draw although the structure relies on random selection each week, and observers note that number seventeen has surfaced in over four hundred draws through the end of twenty twenty-five while lower-frequency balls like fifty-nine trail behind by several dozen appearances. These variations arise naturally from finite sample sizes rather than any mechanical bias, and similar patterns repeat across other national lotteries where long-term records exist.
Appearance Trends Within EuroMillions Draws
EuroMillions records beginning in two thousand four reveal parallel fluctuations in main number frequencies with number twenty-three leading in total hits across more than one thousand draws, and Lucky Star number three has appeared in roughly one in four combinations according to aggregated results. The separate Star pool creates its own set of appearance metrics that differ from the main five, and researchers examining these figures point to expected deviations within statistical norms for random processes.
Comparative Patterns Between the Two Lotteries
Side-by-side examination of the two games highlights how pool size influences appearance rates, with UK Lotto's larger fifty-nine-ball field producing slower convergence toward equal distribution compared to EuroMillions' fifty-ball main selection, and data shows that the most frequent UK Lotto numbers have appeared approximately ten percent more often than the least frequent ones over equivalent time spans. EuroMillions Lucky Stars meanwhile cluster more tightly around their theoretical averages because of the smaller twelve-ball range, yet both lotteries display the same core characteristic that every number retains identical probability on each independent draw.
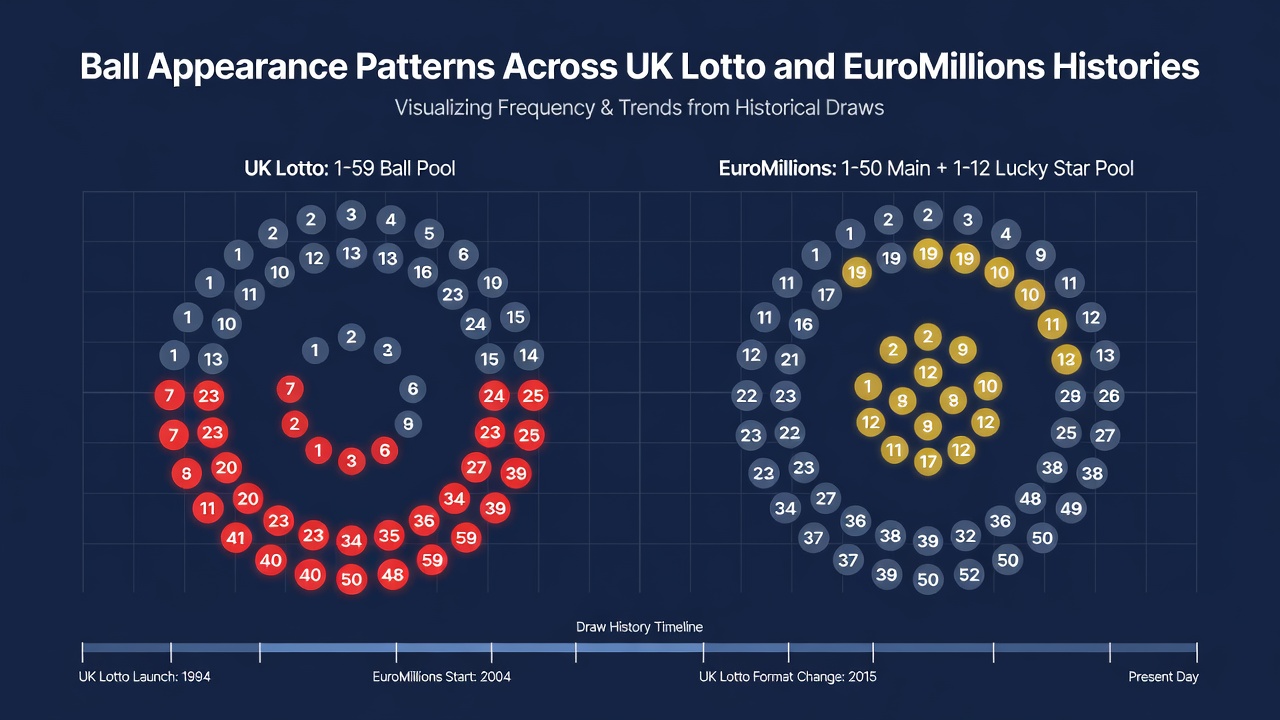
Analysts at the European Lotteries association have compiled multi-country datasets that place these UK and EuroMillions patterns alongside other European games, and the comparisons confirm that variance decreases as total draws increase without eliminating short-term imbalances entirely.
Developments Observed Through Mid-Twenty Twenty-Six
Records extending into August twenty twenty-six continue to track incremental shifts in appearance counts, and the addition of roughly one hundred additional draws for each game has narrowed some earlier gaps while widening others in line with random expectations. Observers tracking these updates note that no number has maintained a consistent lead across every five-year window, and the rolling nature of the data means leadership positions change as new results accumulate.
Statistical Context and External Research
Studies examining lottery randomness often reference these large public datasets because they offer verifiable sequences free from external variables, and a report from the Canadian Lottery statistics archive demonstrates how similar frequency tracking applies across different national formats with comparable outcomes. The underlying mathematics remains consistent regardless of jurisdiction, and appearance patterns serve primarily as descriptive tools rather than predictive ones.
Conclusion
Ball appearance patterns across UK Lotto and EuroMillions histories illustrate the natural variability inherent in repeated random selections, and continued monitoring through twenty twenty-six and beyond simply adds more data points to already extensive records. These patterns remain useful for historical documentation even as each new draw resets probabilities to equal levels for every remaining ball.